US de-SPAC M&A: Commentary
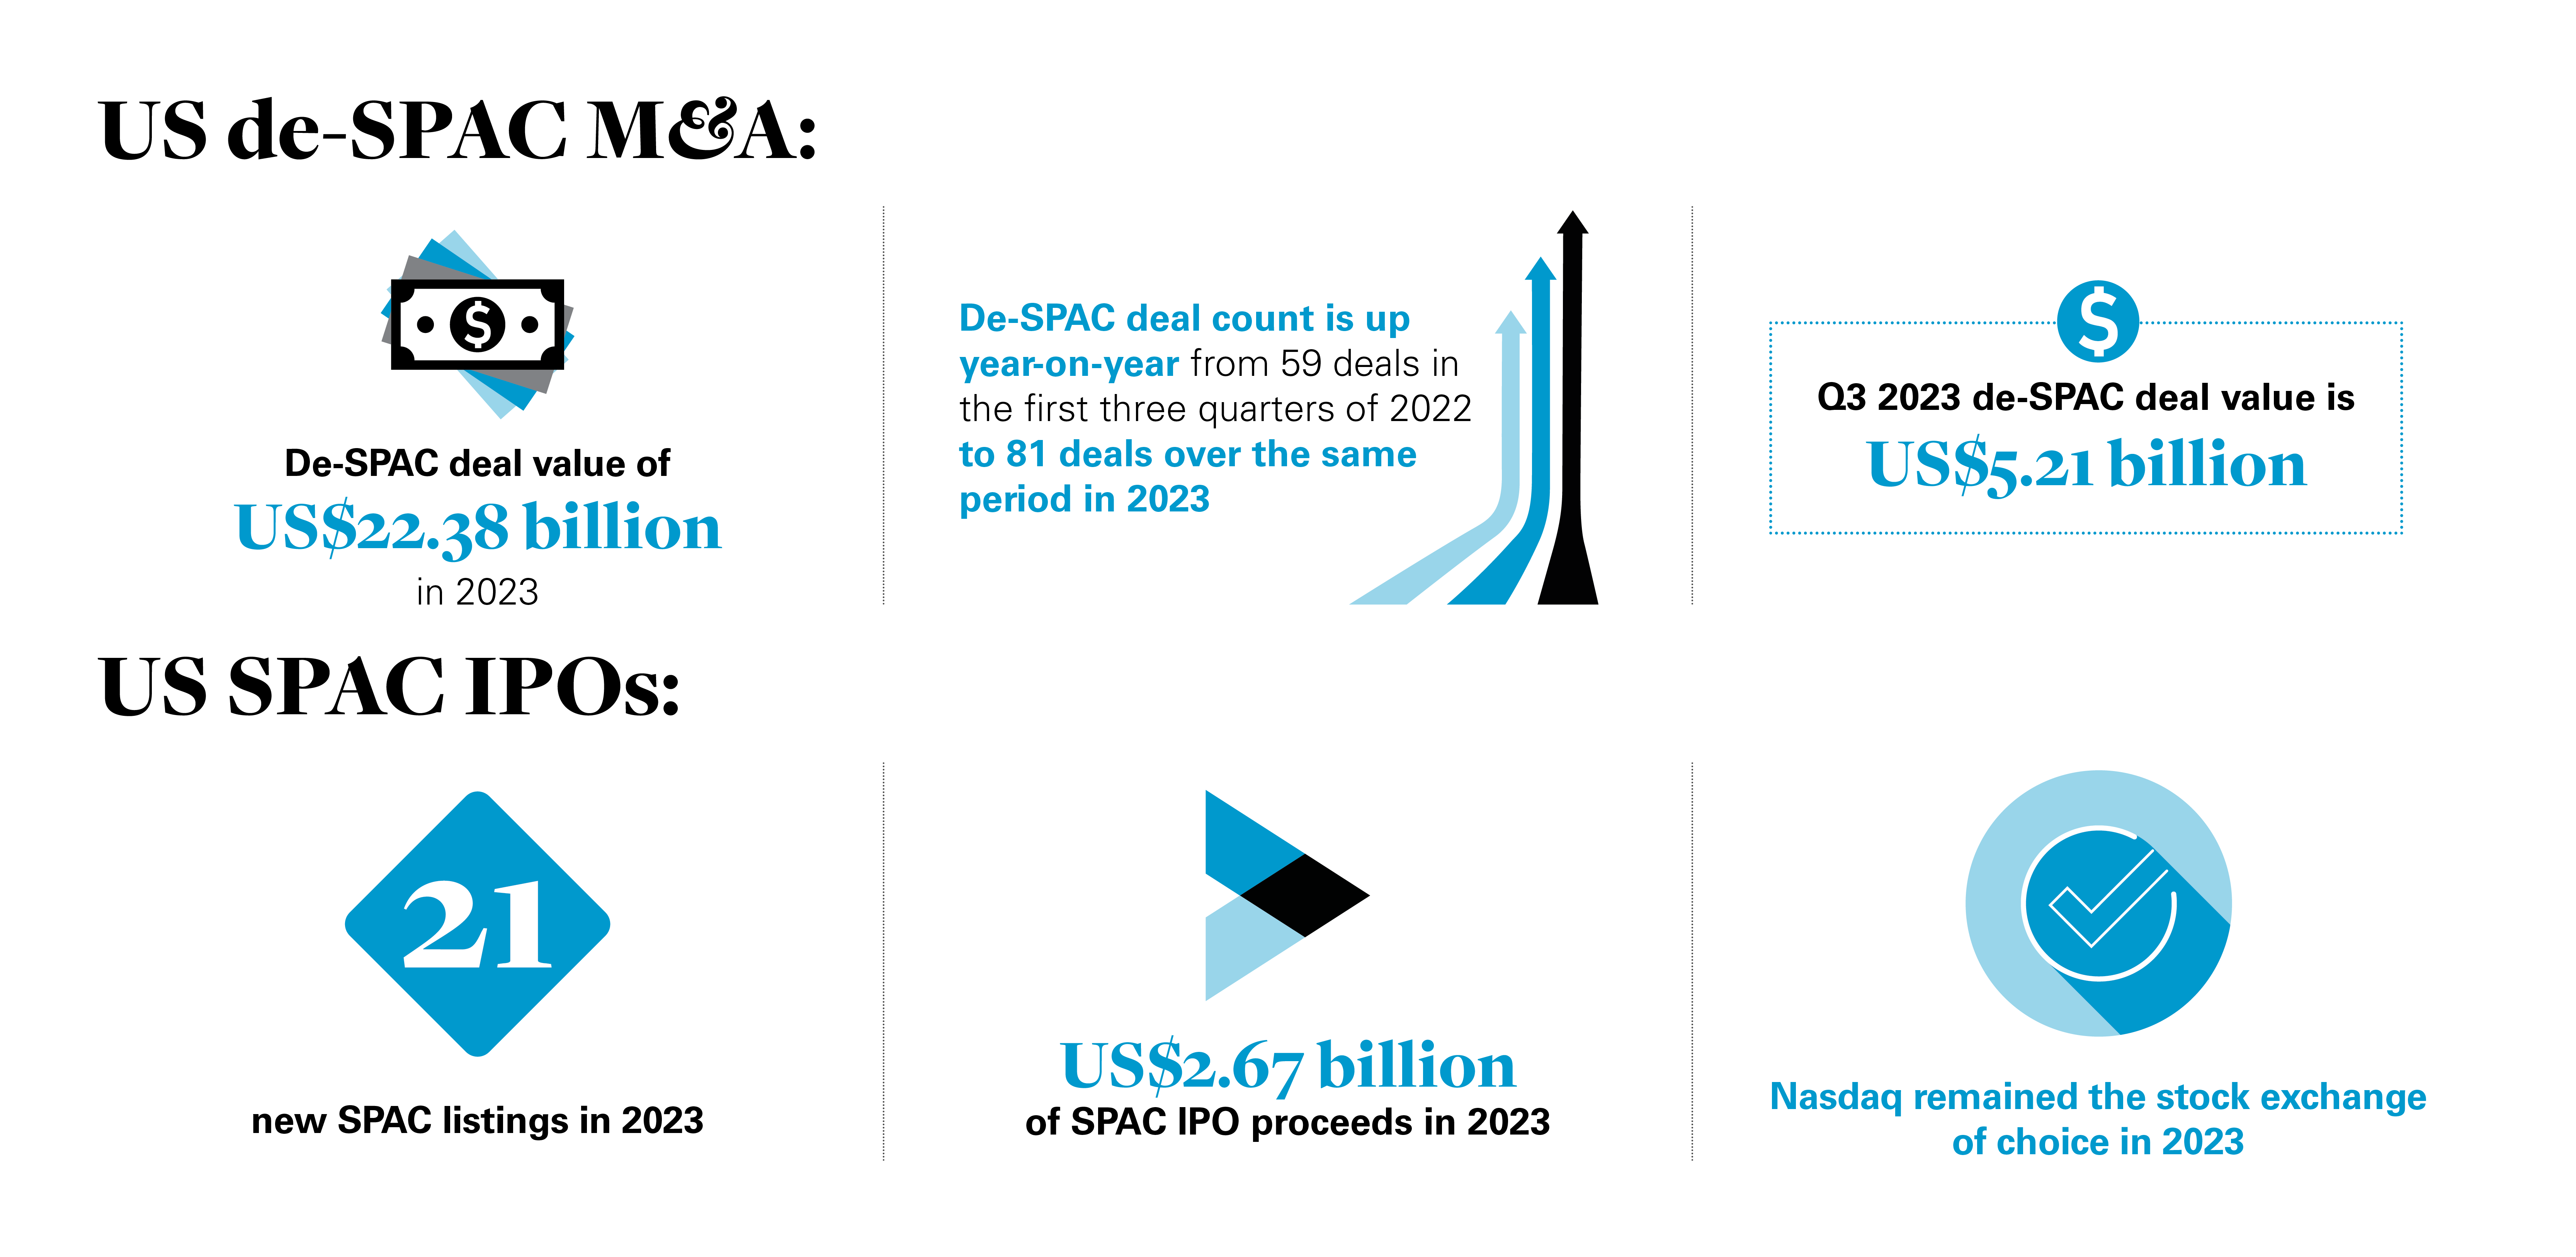
US de-SPAC business combination deal value totaled US$22.38 billion over the first three quarters of 2023, down 25% year-on-year from US$29.78 billion during the first three quarters of 2022.
The decline in de-SPAC deal value has mirrored the slowdown across wider M&A markets, where the decrease in overall deal value has been even steeper, dropping 33 percent from US$2.91 trillion for the first three quarters of 2022 to US$1.95 trillion over the same period in 2023, according to Bloomberg1.
The fall in overall M&A markets has pushed M&A value down to the lowest three-quarter total since 2013. Against this challenging backdrop, de-SPAC deal value has demonstrated a degree of resilience, with value still ahead of pre-pandemic levels2.
Despite the fall in de-SPAC deal value over the first three quarters of the year, de-SPAC business combination deal count has improved year-on-year, up from 59 business combinations for the first three quarters of 2022 to 81 business combinations over the same period in 2023.
Indeed, business combination deal count for the first three quarters of 2023 has only been bested by the 159 deals landed at the peak of the market across the first three quarters of 2021.
This indicates that SPAC sponsors remain active and ready to pursue deals and target companies when the right opportunities emerge.
On a quarter-by-quarter basis de-SPAC deal value and volumes are down from Q2 2023.
Q3 2023 de-SPAC deal value came in at US$5.21 billion versus US$8.61 billion for Q2 2023, with de-SPAC deal volume marginally lower, down to 22 business combinations in Q3 2023 from 26 business combinations in the previous quarter.
1 Bloomberg Law: ANALYSIS: Dismal Q3 M&A Deal Volumes Dampen End-of-Year Outlook. See par 2.
2 Bloomberg Law: ANALYSIS: Dismal Q3 M&A Deal Volumes Dampen End-of-Year Outlook. See par 2.
US SPAC IPOs: Commentary
New SPAC listings have slowed through the course of 2023, with only 21 SPAC IPOs pricing on US stock exchanges during the first three quarters of 2023, down from 76 during the same period in 2022.
Year-on-year SPAC IPO proceeds have also declined, dropping 79 percent from US$12.46 billion for Q1 – Q3 2022 to just US$2.67 billion for the same period this year.
The drop in SPAC IPO activity has mirrored the slowdown in overall IPO activity.
SPAC listings are also down on a quarterly basis, with five IPOs raising proceeds of US$770 million in Q3 2023, versus six listings raising US$1.08 billion in Q2 2023.
SPAC IPO volumes for Q3 2023 represent the lowest level seen since the start of 2021, although proceeds are slightly better than the final two quarters of 2022.
For the few SPAC sponsors that have secured IPOs, Nasdaq has remained the stock exchange of choice in 2023.
Of the 21 SPAC IPOs in the US so far this year, 18 have listed on Nasdaq, with the New York Stock Exchange (NYSE) only securing three SPAC listings.
With only one quarter of 2023 remaining, both exchanges remain well shy of matching the annual SPAC IPO totals recorded in 2022, when Nasdaq posted 72 SPAC IPOs and the NYSE secured 12.
US de-SPAC M&A data
These statistics track the de-SPAC mergers involving a US target from January 1, 2019 to September 30, 2023.
Annual summary of de-SPAC transactions in the US
This chart shows de-SPACs in the US by volume and value between January 2019 and September 30, 2023.
January 1, 2019 to September 30, 2023
|
Rank date |
Number of deals |
Market share (%) |
|
2019 |
30 |
6 |
|
2020 |
99 |
20 |
|
2021 |
196 |
39 |
|
2022 |
96 | 19 |
|
2023 |
81 | 16 |
|
Industry Total |
502 |
100 |
Source: Refinitiv, an LSEG business
Quarterly summary of de-SPAC transactions in the US
This chart shows de-SPACs in the US by volume and value between January 2019 and September 30, 2023.
January 1, 2019 to September 30, 2023
|
Rank date |
Number of deals |
Market share % |
|
2019 Q1 |
3 | 1 |
|
2019 Q2 |
4 | 1 |
|
2019 Q3 |
13 | 3 |
|
2019 Q4 |
10 | 2 |
|
2020 Q1 |
9 | 2 |
|
2020 Q2 |
8 | 2 |
|
2020 Q3 |
34 | 7 |
|
2020 Q4 |
48 | 10 |
|
2021 Q1 |
80 | 16 |
|
2021 Q2 |
51 | 10 |
|
2021 Q3 |
28 | 6 |
|
2021 Q4 |
37 | 7 |
|
2022 Q1 |
13 | 2 |
|
2022 Q2 |
25 |
5 |
|
2022 Q3 |
21 | 4 |
|
2022 Q4 |
37 | 7 |
|
2022 Q1 |
33 | 6 |
|
2022 Q2 |
26 | 5 |
|
2023 Q3 |
22 | 4 |
|
Industry Total |
502 | 100 |
Source: Refinitiv, an LSEG business
Number of de-SPAC deals in the US by target industry
This chart shows de-SPACs in the US by volume, value and target industry between January 2019 and September 30, 2023.
January 1, 2019 to September 30, 2023
|
Target macro-industry |
Number of deals |
Market share % |
|
Healthcare |
22 | 27 |
|
High Technology |
19 | 24 |
|
Energy and Power |
10 | 12 |
|
Industrials |
7 | 9 |
|
Consumer Products and Services |
7 | 9 |
|
Financials |
4 | 5 |
|
Materials |
3 | 4 |
|
Telecommunications |
3 | 4 |
|
Retail |
2 | 2 |
|
Media and Entertainment |
2 | 2 |
|
Consumer Staples |
2 | 2 |
|
Industry Total |
81 | 100 |
Source: Refinitiv, an LSEG business
De-SPAC M&A: Sectors in focus
Healthcare
Top-three largest de-SPAC deals:
- Semper Paratus Acquisition Corp. announced a business combination with Tevogen Bio in a US$1.41 billion deal
- American Gene Technologies agreed to an US$800 million business combination with 10X Capital Venture Acquisition Corp.
- Atlantic Coastal Acquisition Corp. II announced a business combination with Abpro Corp. in a US$725 million deal
The long-term drivers of growth in the healthcare sector have made the sector the most active for business combination deals through the course of 2023.
Due to the resilience the healthcare industry demonstrates through market downturns, as well as secular trends including an aging population, higher rates of chronic illness and rapid medical innovation, SPAC sponsors have invested US$6.92 billion in 22 business combinations with healthcare targets.
Semper Paratus Acquisition Corp. has led with the largest de-SPAC deal in the healthcare space in 2023, announcing a US$1.41 billion business combination with Tevogen Bio, a developer of T-cell therapy technologies used in COVID-19 treatments3.
In the second-largest healthcare de-SPAC in the first three quarters of 2023, American Gene Technologies agreed to an US$800 million business combination with 10X Capital Venture Acquisition Corp. The business, which will be renamed Addimmune on completion, is a clinical-stage gene and cell therapy company developing a cure for HIV4.
In the third-largest de-SPAC in the sector year to date, Atlantic Coastal Acquisition Corp. II announced a business combination with Abpro Corp. in a US$725 million deal. After withdrawing their proposed IPO five years ago, Abpro, which develops a range of antibodies used to fight a variety of diseases5, has opted to seek a listing via a business combination the second time around6.
3 Reuters: Biotech firm Tevogen Bio enters $1.2 billion SPAC deal for US listing
4 DealFlow's SPAC News: Gene Therapy Company Merging with 10x Capital Venture Acquisition III in $500M Deal
5 abpro: Next-Generation Antibody Therapies
6 Fierce Biotech: Antibody biotech Abpro taps SPAC to get back on Nasdaq track 5 years after axed IPO
Technology
Top-three largest de-SPAC deals:
- iLearningEngines announced a US$1.28 billion business combination with Arrowroot Acquisition Corp.
- Allurion Technologies announced a US$481 million business combination with Compute Health Acquisition Corp.
- BYTE Acquisition Corp. announced a US$301.13 million business combination with Airship AI Holdings
Technology was the second-largest de-SPAC sector by value and volume over the first three quarters of 2023, with 19 business combination deals worth US$4.04 billion.
Rising interest rates and corrections to technology company valuations have put the brakes on overall M&A in the technology sector, but the ongoing digitalization of businesses across all industries and investor interest in opportunities across AI, machine learning and big data have helped to sustain de-SPAC deal flow in the sector.
The AI capabilities of training company iLearning, for example, have made it the largest de-SPAC tech deal so far this year after announcing a US$1.28 billion business combination with Arrowroot Acquisition Corp. According to Reuters, iLearning has earmarked some of the proceeds to finance acquisitions.
In the second-largest technology de-SPAC deal in 2023, healthtech company Allurion Technologies, a provider of AI applications used to monitor patients remotely, agreed to a US$481 million business combination with Compute Health Acquisition Corp.7
In the third-largest de-SPAC in the sector, Airship AI Holdings agreed to a US$301.13 million business combination with BYTE Acquisition Corp. Airship provides AI-driven edge video, sensor and data management platforms.
7 Bariatric News: Allurion links up with Compute Health Acquisition to become publicly listed company
Energy and power
Largest de-SPAC deals:
- Oklo agreed to a US$1 billion business combination with AltC Acquisition Corp.
- Honeycomb Battery Co. agreed to a US$954.6 million business combination with Nubia Brand International Corp.
- Montana Technologies announced a US$618.14 million business combination with Power & Digital Infrastructure Acquisition II Corp.
The increased government and corporate focus to reduce carbon emissions to mitigate the impacts of climate change and facilitate energy transition have made energy and power an increasingly important target industry for SPAC sponsors.
The sector ranked as the third-largest by volume and value for de-SPAC deal activity, with 10 business combinations worth US$3.91 billion.
In the largest business combination in the sector for the year-to-date, Oklo, a nuclear reactor business, agreed to a US$1 billion business combination with AltC Acquisition Corp. AltC Acquisition Corp. is a SPAC backed by Sam Altman, the chief executive of ChatGPT developer OpenAI8.
Energy transition and clean energy also supported the second-largest energy and power de-SPAC of the year, as Nubia Brand International Corp. agreed to a US$954.6 million business combination with Honeycomb Battery Co., a developer of batteries for electric vehicles9.
Montana Technologies and Power & Digital Infrastructure Acquisition II Corp. announced a US$618.14 million business combination, the third-largest de-SPAC deal in the sector. Montana Technologies develops renewable energy and cooling technologies10.
Research from wealth manager Fiduciary Trust International indicates that investment in physical assets related to energy transition will triple to between US$4.4 trillion and US$6.5 trillion a year over the next three decades11, with decarbonization and green energy expected to drive ongoing business combination deal activity.
8 Reuters: Nuclear startup Oklo to go public in US via Sam Altman's SPAC
9 Global Graphene Group: Honeycomb Generates Buzz via SPAC Merger
10 DealFlow's SPAC News: Montana Technologies to Combine with Power & Digital Infrastructure Acquisition II in $500M Deal
11 Nasdaq: Global Investment Opportunities in the Energy Transition. See par 5.
Industrials
Largest de-SPAC deals:
- Kernel Group Holdings agreed to a business combination with AIRO Group Holdings in a US$1.1 billion deal
- Marblegate Acquisition Corp. agreed to a business combination with DePalma in a US$755 million deal
- World View Enterprises agreed to a business combination with Leo Holdings Corp. II in a US$350 million transaction
The industrials sector ranked as the fourth-largest for de-SPAC deal activity by volume and value in the first three quarters of 2023, with seven deals valued at US$2.62 billion.
Digitalization, automation and decarbonization have been key drivers of de-SPAC transactions in the sector.
In the largest industrials de-SPAC deal of the year so far, Kernel Group Holdings and AIRO Group Holdings, an aerospace and defense company, announced a US$1.1 billion business combination. AI capability was a key driver for the investment in AIRO, which develops drone, AI and air taxi technology12.
In the second-largest industrials de-SPAC deal of the year, Marblegate Acquisition Corp. and DePalma, a company holding taxi operation licenses in New York, Philadelphia and Chicago13, announced a US$755 million business combination.
World View Enterprises, a stratospheric flight and exploration business14, agreed to a business combination with Leo Holdings Corp II in US$350 million deal, despite a number of aerospace de-SPAC deals underperforming following their business combinations15.
12 Flying: Kernel Group Holdings To Merge With eVTOL Developer AIRO Group
13 DealFlow's SPAC News: Marblegate Acquisition Merging with DePalma Companies in $755M Deal
14 businesswire: Stratospheric Exploration Leader World View to Go Public via SPAC Deal with Leo Holdings Corp. II
15 Space News: How wrong were space SPAC projections?
Financials
Largest de-SPAC deals:
- Vahanna Tech Edge Acquisition I Corp. announced a US$965 million business combination with Roadzen
- K Enter Holdings announced a US$610 million business combination with Global Star Acquisition Inc.
- Global Blockchain Acquisition announced a US$175 million business combination with Cardea Corporate Holdings
Even though the four financials de-SPAC deals in the first three quarters of 2023 put the sector behind consumer products and services (seven deals) on deal count, financials still ranked comfortably as the fifth-largest sector by value, with US$1.81 billion worth of business combinations.
Insuretech developer Roadzen led the sector with an announced US$965 million business combination with Vahanna Tech Edge Acquisition I Corp in a deal that represents more than half of the total de-SPAC deal value in the financials sector this year. With a focus on car insurance, Roadzen’s technology offers discounted premiums and smoother claims processing using telematics and AI. The company has secured insurance distribution licenses in a number of international markets.
In the second and third-largest financials de-SPACs of 2023, K Enter Holdings announced a US$610 million business combination with Global Star Acquisition Inc., while Global Blockchain Acquisition Corp. announced a US$175 million business combination with Cardea, a wealth manager using digital tools to make wealth management services and advice more accessible16.
De-SPAC M&A figures and coverage include both announced and completed transactions.
US SPAC IPOs data
These statistics track the SPAC IPOs that have listed on US stock exchanges from January 1, 2019 to September 30, 2023.
Annual breakdown of US-listed SPAC IPOs
This chart shows the breakdown of annual SPAC IPOs listed on the US stock exchanges by volume between January 2019 and September 30, 2023.
January 1, 2019 to September 30, 2023
|
Year |
Number of issues |
SPAC IPO market share % |
|
2019 |
59 |
6 |
|
2020 |
247 |
24 |
|
2021 |
613 |
60 |
|
2022 |
84 | 8 |
|
2023 |
21 | 2 |
|
Total |
1,024 |
100 |
Source: Refinitiv, an LSEG business
Quarterly breakdown of US-listed SPAC IPOs
This chart shows the quarterly breakdown of SPAC IPOs listed on the US stock exchanges by volume between January 2019 and September 30, 2023.
January 1, 2019 to September 30, 2023
|
Rank date |
Number of deals |
Market share % |
|
2019 Q1 |
15 | 2 |
|
2019 Q2 |
13 | 1 |
|
2019 Q3 |
14 | 1 |
|
2019 Q4 |
17 | 2 |
|
2020 Q1 |
13 | 1 |
|
2020 Q2 |
24 | 2 |
|
2020 Q3 |
82 | 8 |
|
2020 Q4 |
128 | 12 |
|
2021 Q1 |
297 | 29 |
|
2021 Q2 |
64 | 6 |
|
2021 Q3 |
88 | 9 |
|
2021 Q4 |
164 | 16 |
|
2022 Q1 |
54 | 5 |
|
2022 Q2 |
14 |
1 |
|
2022 Q3 |
8 | 1 |
|
2022 Q4 |
8 | 1 |
|
2023 Q1 |
10 | 1 |
|
2023 Q2 |
6 | 1 |
|
2023 Q3 |
5 | 1 |
|
Industry Total |
1,024 | 100 |
Source: Refinitiv, an LSEG business
Annual Nasdaq and NYSE breakdown of US-listed SPAC IPOs
This chart shows the breakdown of annual SPAC IPOs listed on Nasdaq and the NYSE by volume.
January 1, 2019 to September 30, 2023
|
Year |
Listed on Nasdaq |
Listed on NYSE |
Total |
|
2019 |
43 | 16 | 59 |
|
2020 |
131 | 116 | 247 |
|
2021 |
432 | 181 | 613 |
|
2022 |
72 | 12 | 84 |
|
2023 |
18 | 3 | 21 |
|
Total |
696 | 328 | 1,024 |
Source: Refinitiv, an LSEG business
Top 10 US SPAC IPO issuers by proceed amount
This chart shows the top-10 US SPAC IPO issuers between January 2019 and June 2023.
January 1, 2019 to September 30, 2023
|
Issuer |
Number of issues |
SPAC IPO market share % |
Total proceeds US$ million |
|
Pershing Square Tontine Holdings Ltd |
1 | 0.1 | 4,000.00 |
|
Churchill Capital Corp IV |
1 | 0.1 | 2,070.00 |
|
Soaring Eagle Acquisition Corp |
1 | 0.1 | 1,725.00 |
|
Foley Trasimene Acquisition Corp II |
1 | 0.1 | 1,467.03 |
|
Churchill Capital Corp VII |
1 | 0.1 | 1,380.00 |
|
KKR Acquisition Holdings I Corp |
1 | 0.1 | 1,380.00 |
|
Austerlitz Acquisition Corp II |
1 |
0.1 |
1,380.00 |
|
Social Capital Hedosophia Holdings Corp VI |
1 | 0.1 | 1,150.00 |
|
Foley Trasimene Acquisition Corp |
1 | 0.1 | 1,035.00 |
|
Jaws Mustang Acquisition Corp |
1 | 0.1 | 1,035.00 |
Source: Refinitiv, an LSEG business
Issuer by number of US SPAC IPO listings
The following charts show US SPAC IPOs by the issuer (by number of issues for 2023, 2022, 2021, 2020 and 2019).
Q3 2023
|
Issuer |
Number of issues |
Market share % |
|
United States |
17 | 80 |
|
China (Mainland) |
1 | 5 |
|
Taiwan |
1 | 5 |
|
Canada |
1 | 5 |
|
Malaysia |
1 | 5 |
|
Industry Total |
21 | 100 |
Source: Refinitiv, an LSEG business
Full-year 2022
|
Issuer |
Number of issues |
Market share (%) |
|
United States |
65 | 77 |
|
Cayman Islands |
4 | 5 |
|
Singapore |
4 | 5 |
|
Malaysia |
3 | 4 |
|
China (Mainland) |
3 | 4 |
|
Hong Kong |
2 | 2 |
|
Sweden |
1 |
1 |
|
Mexico |
1 | 1 |
|
United Kingdom |
1 | 1 |
|
Industry Total |
84 | 100 |
Source: Refinitiv, an LSEG business
Full-year 2021
|
Issuer |
Number of issues |
Market share (%) |
|
United States |
538 | 87.8 |
|
Cayman Islands |
26 | 4.2 |
|
Hong Kong |
16 | 2.6 |
|
United Kingdom |
5 | 0.8 |
|
Singapore |
5 | 0.8 |
|
Israel |
4 | 0.7 |
|
Malaysia |
4 |
0.7 |
|
China (Mainland) |
2 | 0.3 |
|
South Africa |
1 | 0.2 |
|
Russia |
1 | 0.2 |
|
Germany |
1 | 0.2 |
|
Cyprus |
1 | 0.2 |
|
Bermuda |
1 | 0.2 |
|
Bahamas |
1 | 0.2 |
| Canada | 1 |
0.2 |
| Switzerland | 1 |
0.2 |
| Brazil | 1 |
0.2 |
| Kazakhstan | 1 |
0.2 |
| Mexico | 1 |
0.2 |
| Netherlands | 1 |
0.2 |
| Taiwan | 1 |
0.2 |
|
Industry Total |
613 | 100 |
Source: Refinitiv, an LSEG business
Full-year 2020
|
Issuer |
Number of issues |
Market share (%) |
|
United States |
224 | 90.7 |
|
Cayman Islands |
5 | 2.0 |
|
China (Mainland) |
5 | 2.0 |
|
United Kingdom |
4 | 1.6 |
|
Hong Kong |
4 | 1.6 |
|
Singapore |
2 | 0.8 |
|
Israel |
1 | 0.4 |
|
Russia |
1 |
0.4 |
|
Mexico |
1 | 0.4 |
|
Industry Total |
247 | 100 |
Source: Refinitiv, an LSEG business
Full-year 2019
|
Issuer |
Number of issues |
Market share (%) |
|
United States |
52 | 88 |
|
Singapore |
2 | 3 |
|
Hong Kong |
2 | 3 |
|
Cayman Islands |
1 | 2 |
|
Mexico |
1 |
2 |
|
China (Mainland) |
1 | 2 |
|
Industry Total |
59 | 100 |
Source: Refinitiv, an LSEG business
Issuer nation by number of US SPAC IPO listings
This chart shows US SPAC IPOs by the issuer nation (by number of issues between January 2019 and September 2023).
January 1, 2019 to September 30, 2023
|
Issuer |
Number of issues |
Market share % |
|
United States |
896 | 87.5 |
|
Cayman Islands |
36 | 3.5 |
|
Hong Kong |
24 | 2.3 |
|
Singapore |
13 | 1.3 |
|
China (Mainland) |
12 | 1.2 |
|
United Kingdom |
10 | 1.0 |
|
Malaysia |
8 |
0.8 |
|
Israel |
5 | 0.5 |
|
Mexico |
4 | 0.4 |
|
Russia |
2 | 0.2 |
|
Canada |
2 | 0.2 |
|
Taiwan |
2 | 0.2 |
|
South Africa |
1 | 0.1 |
| Germany | 1 |
0.1 |
|
Cyprus |
1 | 0.1 |
|
Bermuda |
1 | 0.1 |
|
Bahamas |
1 | 0.1 |
|
Switzerland |
1 | 0.1 |
|
Brazil |
1 | 0.1 |
|
Sweden |
1 | 0.1 |
|
Kazakhstan |
1 | 0.1 |
|
Netherlands |
1 | 0.1 |
|
Industry Total |
1,024 | 100 |
Source: Refinitiv, an LSEG business
The issuer’s country is based on the address for notices provided by a SPAC on its registration statement and other relevant sources, and does not necessarily reflect the SPAC’s jurisdiction of incorporation or formation.
Beyond the numbers
The next iteration: From SPAC to SPARC
Hedge fund manager Bill Ackman recently secured approval from the Securities and Exchange Commission (SEC) for a new type of investment vehicle — a special purpose acquisition rights company (SPARC).
After the 2021 SPAC boom, do SPARCs represent the next evolution of the blank check company industry?
In September 2023, hedge fund manager Bill Ackman obtained clearance from the Securities and Exchange Commission (SEC) to bring a new type of blank check company — a special purpose acquisition rights company (SPARC) — to market17.
The SPARC is a variation on the special purpose acquisition company (SPAC) model and could offer investors an alternative to SPACs after a challenging period for blank check companies.
After cresting record highs in the bull markets of 2021, SPAC IPOs and business combinations dropped off sharply in 2022 and 2023, as inflation and rising interest rates saw investors recalibrate risk thresholds and pivot away from the SPAC space.
In addition to building macro-economic headwinds, redemption rates have also been climbing, leaving SPACs with smaller amounts of capital to fund deals (according to SPAC Research, 90 percent of investors voted against proposed deals in 2023, preferring to take cash back instead)18.
Unlike SPACs, SPARCs will not issue shares, but rights entitling backers to buy shares at a later date, usually once a deal has been announced, according to Reuters19. Investors stand to benefit, as they will know what company is being targeted in a deal and will only be asked for cash once a deal is announced. This will avoid situations where capital sits in trust for up to two years while a SPAC searches for a deal, only to be handed back to investors that choose to redeem their SPAC shares rather than participate in the business combination.
SPARCs could help by offering investors more flexibility, lower risk and better visibility on deal targets.
SPARCs will also have longer (up to ten years) to do a deal rather than the typical two-year period SPACs are allowed. This should mitigate the risk of investment period cliff edges. Underwriting costs will also be reduced as the SPARC will not have to hire banks to distribute acquisition rights.
According to Reuters, SPARCs will not offer IPO warrants either. SPACs have used these warrants to add to the capital piles secured in the SPAC IPO, leading to dilution of underlying investors when IPO warrants were exercised20.
The question now is whether SPARCs, which like SPACs are designed to offer private companies a smoother, more cost-effective pathway to a stock market listing, will be able to address the investor concerns that have cooled SPACs sentiment.
Ackman's SPARC has already signalled its intentions to get a deal done (possibly with X, formerly Twitter). Time will tell whether the SPARC structure can reignite this market after the difficulties encountered by SPACs during the past year.
17 CBNC: Bill Ackman’s ‘SPARC’ gets OK from the SEC and he’s ready for a deal: ‘please call me’
18 Russell Investments: The state of the SPAC market. See par 4.
19 Reuters: Explainer: How Bill Ackman's SPARC differs from a SPAC.
20 Reuters: Explainer: How Bill Ackman's SPARC differs from a SPAC.